 Lease
Lease
 Buy
Buy


In the latest Office Market Report released on the 1st of August, Property Council of Australia (PCA) has found that Melbourne CBD’s vacancy rate, at 3.3%, is the lowest CBD vacancy rate nationwide. This, however, was a slight increase from 3.2% in January 2019.
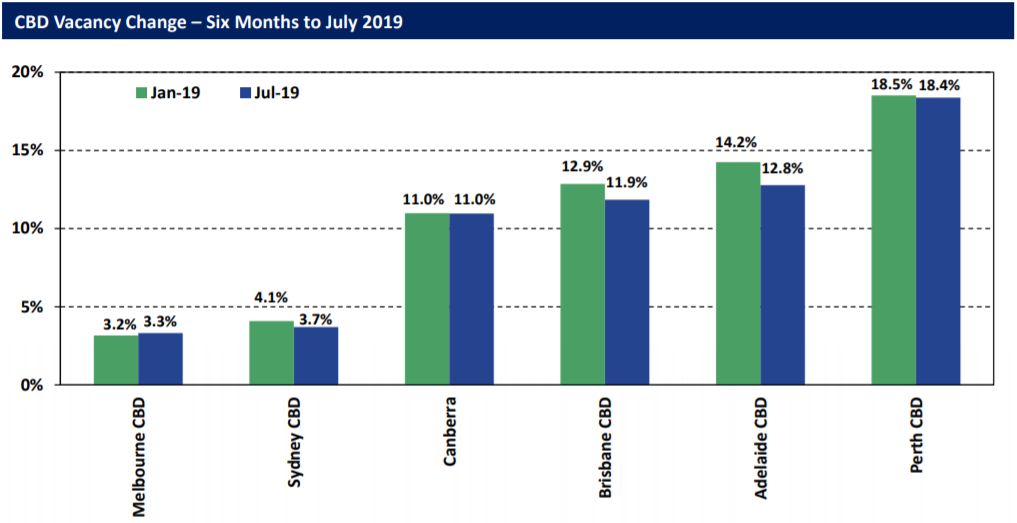
Melbourne’s CBD was the only CBD market to record an increase in vacancy rates. Nevertheless, its vacancy rate is still the lowest amongst the other CBD markets. (Image Source: Property Council of Australia).

New supply is offset by stock withdrawal and tenant demand. (Image Source: Property Council of Australia).
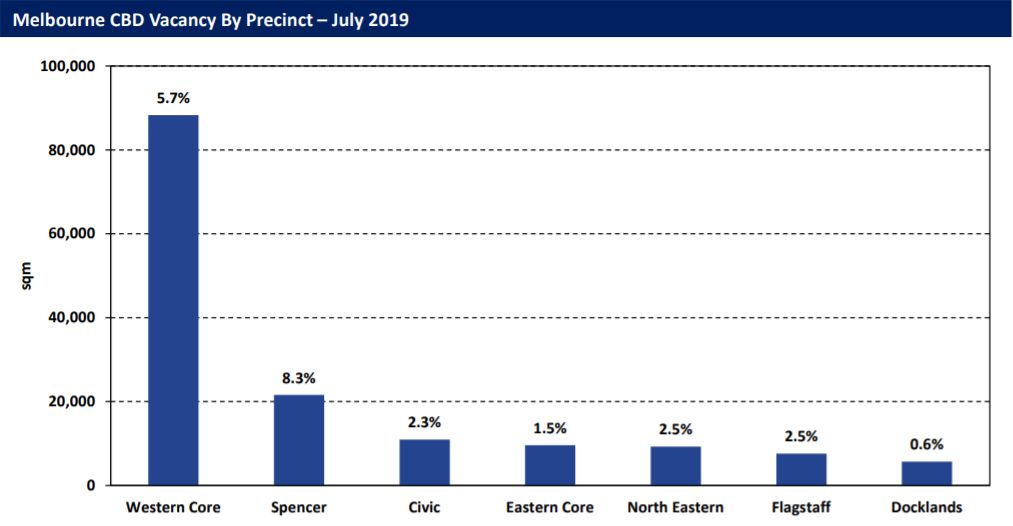
Vacancy rates by market area show that vacancy rates are highest in the Western Core segment. (Image Source: Property Council of Australia).
On the supply side, Cressida Wall, PCA’s Victorian Executive Director, raises concerns about the dwindling office supply pipeline.
“To 2023, Melbourne CBD will supply approximately 650,000 sqm of new commercial stock. However, half of that stock is pre-committed and there is little to no, new office space in the pipeline beyond 2023.”

More than two thirds of the 1.4 million sqm of stock will be in Melbourne and Sydney’s CBDs. 49.4% of Melbourne CBD’s future stock is pre-committed. (Image Source: Property Council of Australia).
PCA cites C270 planning controls as a contributing factor of reduced supply. C270, which was introduced in 2016, guided development in the central city, consisting of the Hoddle Grid and Southbank. It included provisions to ensure adequate separation between tall buildings, as well as a value capture system to provide public benefits if the development exceeds a floor-to-area ratio of 18:1. These public benefits may include open space, laneways, community space or affordable housing.
It was argued that the CBD may not be able to accommodate its forecasted job growth as a result of decreased commercial approvals. In a report prepared by Urbis and commissioned by the PCA’s Victorian Division, Urbis estimated that to accommodate Melbourne’s growth, Melbourne’s CBD will need another 9.1 million sqm in floorspace, 4.4 million sqm of which would be commercial space. Urbis believes that the CBD is facing a shortage of office space, which could, they estimated, cost as much as $7 billion in lost jobs.
Colliers International’s 2019 H1 CBD Office commentary pointed out that the 18:1 floor-to-area ratio requirement significantly reduced the capacity for developers to deliver spaces with larger floor plates of around 1800 to 2000 sqm. It was explained that larger floor plates are preferred by tenants, especially Melbourne’s larger occupiers, leading to strong tenant commitments and hence employment growth.
Ms Wall said, “with Melbourne’s population set to match that of Sydney by 2028, immediate action is required to ensure that Melbourne’s CBD is able to accommodate its growing workforce.”
PCA welcomes Planning Minister Richard Wynne’s comments that these controls may be eased. Nevertheless, it still urges these changes: “However, until changes are implemented, CBD approvals remain at a standstill. This position is untenable and changes to C270 to support commercial development are the release valve Melbourne urgently needs if it is to continue to develop as a thriving global commercial hub.”
In other market findings by PCA’s Office Market Reports, Sydney CBD’s vacancy rate dropped from 4.1% to 3.7% in the six months to July 2019, recording its lowest since January 2008. However, the report identified that the decrease in vacancy was mainly due to stock withdrawals, with overall demand being slightly negative, especially in the B, C and D Grade segments.
Brisbane CBD’s vacancy decreased from 12.9% to 11.9%, the lowest since July 2013, while Brisbane Fringe’s vacancy decreased from 15.7% to 13.8%. New demand contributed to the decrease in vacancies, especially with Brisbane Fringe’s A Grade stock. On the other hand, Gold Coast vacancy rates increased from 11.6% to 12.9% due to a fall in demand in all grades except for B Grade stock.
Perth’s CBD office market’s vacancy rates decreased slightly from 18.5% to 18.4% as a result of positive demand. Positive demand in the market was concentrated in the Premium and B Grade segments.
Overall vacancy in Canberra remained at 11%, with vacancy rates decreasing in A and D Grade segments while increasing in B and C Grade segments. Canberra’s vacancy rates are the third lowest CBD vacancy rate behind Melbourne and Sydney.
Adelaide CBD’s vacancy rate has dropped from 14.2% to 12.8% while Adelaide Fringe’s vacancy increased from 12.6% to 13.1%. Despite the CBD’s decrease in vacancy rates, PCA suggests that vacancy rates may rise as a result of South Australia’s land tax regime, whereby its top aggregated tier tax value of 3.7% is 85% higher than that of NSW. PCA believes that this anti-competitive regime may discourage investment.
Nationally, overall office market vacancy rates decreased from 8.5% to 8.3%, although PCA finds that this decrease is mainly due to stock withdrawals. Overall CBD vacancy rates were at 7.9% while non-CBD rates were at 9.3%. Net tenant demand for CBD office grew by only 0.1% over the last 6 months to July 2019. This represents its lowest growth in over four years, which led PCA to suggest a softening economy.
Cover Photo: Melbourne CBD. (Photo: Yong Chuan)
Related Posts


Please enter a valid email address.
Thank you for subscribing!

